Hello!
My name is Ruslana, I’m a content marketer at Solve Marketing. Today I’ve been talking to our team to learn all about web analytics and what it’s all about.
So, what is web analytics and why is it needed?
Violetta, the Head of PM:
In any activity, we plan something, do it, and then see what we’ve done. That’s why analytics is needed everywhere, and digital marketing is no exception.
You can spend a lot of effort promoting your business, but without a system for collecting and comparing information, there is no way to draw conclusions about which source of customer acquisition works best and, in general, what exactly gives an effect and what just wastes resources.
Modern analytical tools allow you to track data both in real time and compare it over different periods, which helps you make predictions or influence the situation directly in the process.
In general, web analytics is used in many areas. So let me tell you a bit about the main ones:
- tracking and analyzing website performance. That is, the system monitors which pages are visited, what actions the user performs on them, and how much time they spend on the resource;
- analytics works in a similar way for apps, which, in addition to the same data as websites, also include certain events, i.e. events within the app that are also tracked;
- analytics of advertising campaigns. It is used either separately or in combination with the main one. This means that various indicators of their effectiveness are tracked.
But of course, this is not all the data that is tracked and analyzed. To tell you about all the possibilities of analytics, we would have to write a book.
What about marketing, how is analytics used in it?
Andrii, Marketer, Traffic Manager:
In marketing, we need data on both the performance of the resource and the effectiveness of advertising campaigns, so we track everything at once for our clients.
Setting up analytics revolves around three tasks:
- What questions are we looking for answers to?
- What data do we need to collect for this?
- How do we visualize and compare this data?
For example, to analyze the effectiveness of advertising sources, you need to collect data on costs and profits from each source and compare them with each other.
You can do this analysis manually, but the more sources you use, the more time you need to spend on it. In addition, manual analysis is affected by the human factor, so reports may contain accidental errors.
Automation of data collection, data aggregation, and visualization helps to get all the necessary reports in real time. And specialists who used to spend time collecting data can use it to do more important work with the project.
What are the main metrics tracked on the website?
Violetta, the Head of PM:
If we’re talking about websites and their performance, there are six main metrics that we track. Let me tell you about them in more detail.
First of all, this is data on entry points, i.e. where people get to the site. Usually, analytical tools indicate the channel, which is a general concept of where the visitor came from, and the source, which is a more precise characteristic of where exactly.
As a rule, for most websites, the main traffic channels are:
- search (organic);
- advertising (paid);
- direct transitions;
- social networks;
- links from other resources.
By analyzing traffic data from these channels, you can allocate your advertising budget more rationally.
I will show you on the screen what a general overview by traffic sources looks like:
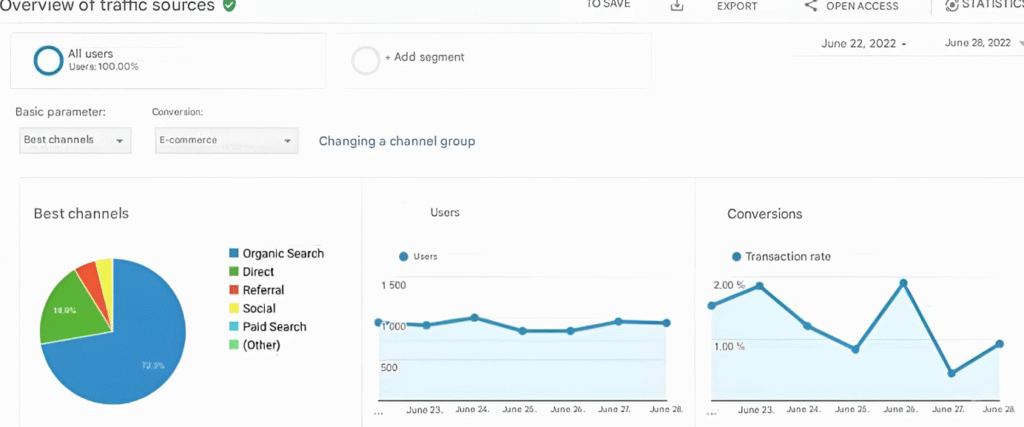
Conversion data is also tracked by source and device. This metric helps to optimize the adaptation of the site to different variants of devices from which the transition takes place.
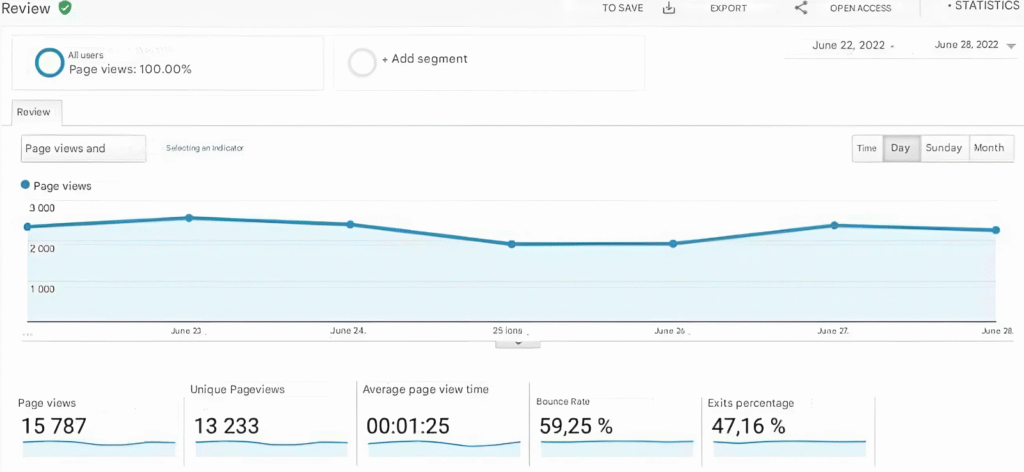
Every website has landing pages, which are the pages where goods and services are sold. For such pages, not only the number of visits to them is important, but also the time the visitor spent there. Therefore, it is also necessary to track this.
If your website has many different pages, it will be useful to know the most popular ones to improve their conversion rate.
With this data, you can adjust your promotion strategy by choosing the most interesting pages to sell your product or service to users, as well as by editing those that are less interesting.
In general, page visit statistics look like this in GA:
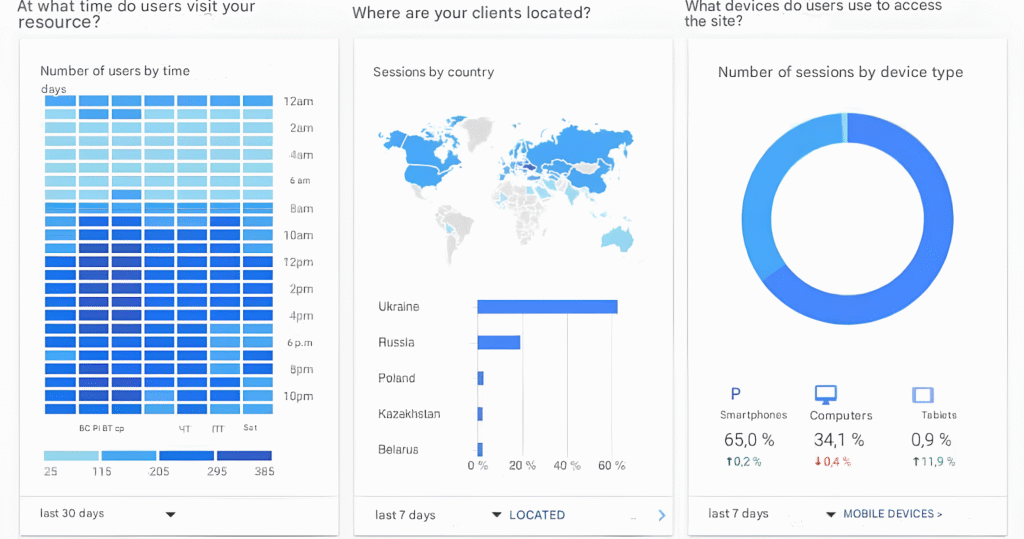
To improve the efficiency of launching advertising campaigns, it will also be useful to track the dynamics of website traffic over time.
This data will show you what time of day is best for publishing articles or running ads, or what time of year is more profitable for launching a promotional offer.
On the screen, I’ll show you exactly what the reports look like by time, device, and location of website visitors:
One of the most important indicators for commercial websites is CAC, which is the cost of customer acquisition, consisting of total marketing costs.
What analytical tools are most often used?
Andrii, Marketer, Traffic Manager:
Of course, the most common tool for collecting analytical data from websites is Google Analytics, the interface you’ve already seen in the screenshots above.
In addition to information about users, audience, traffic sources, and all of the above, Google Analytics allows you to set up a connection with your Google Ads account.
This allows you to set up effective advertising campaigns with conversion optimization and analyze the effectiveness of different ads.
In fact, Google Analytics is the center of all information about your website, visitors, e-commerce, and promotion.
But this all applies to websites, and do mobile apps require different analytical tools?
Kateryna, the COO of Solve Marketing:
Yes, mobile apps have their own tools. Let me tell you a bit about the most popular ones.
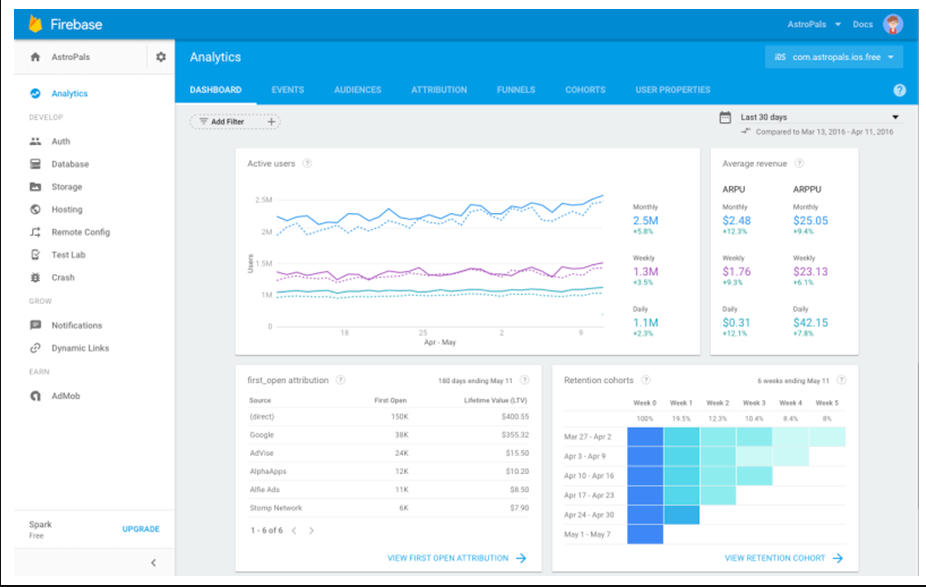
Firebase is a Google tool for creating and promoting mobile applications. It supports iOS, but is still more suitable for Android apps. It is used to refine, test, and optimize applications.
Advantages: interesting and useful because it has crash analytics tools, i.e., it transmits reports on outages in real time, which helps to quickly identify their cause. It is also convenient because it gives you dynamic control over the functionality and appearance of the program. It allows you to enable and disable features, personalize them by audience segments, and conduct experiments without setting up any complex infrastructure or releasing a new version.
Tariffs: there is a free minimum, but then you need to pay extra for exceeding quotas, such as the size of cloud storage or the number of hours to test devices per day.
This is how the general reporting dashboard in Firebase looks like:
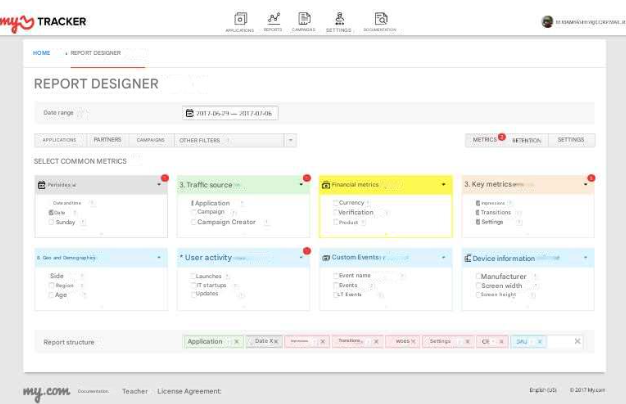
MyTracker is an analytics and attribution system for mobile apps and websites that includes a set of free tools: attribution, product metrics, and predictive analytics.
Advantages: MyTracker works with all major advertising platforms and partners, with the ability to add your own. More than 200 metrics for reporting are available in the interface (ROI, LTV, ARPU, ARPPU, DPU/WPU/MPU, Retention and Rolling Retention, purchases, subscriptions, and other indicators), there are no restrictions on the number of custom events and data storage.
Tariffs: free, with the possibility of connecting additional premium features.
The screenshot shows what a convenient report builder this system has:
Amplitude is a product analytical system that helps you understand how your audience interacts with your product. Amplitude helps you dive deep into behavioral data research with dashboards with key metrics, quick access to A/B test results, and user journey analytics across multiple devices or products.
Benefits: Amplitude uses behavioral analytics and machine learning models to segment audiences and create personalized offers that can then be used in targeted ads, email campaigns, and to optimize in-app product rankings and recommendations.
Tariffs: free and several premium options.
The main dashboard is shown on the screen, where you can customize the options for visualization reports:
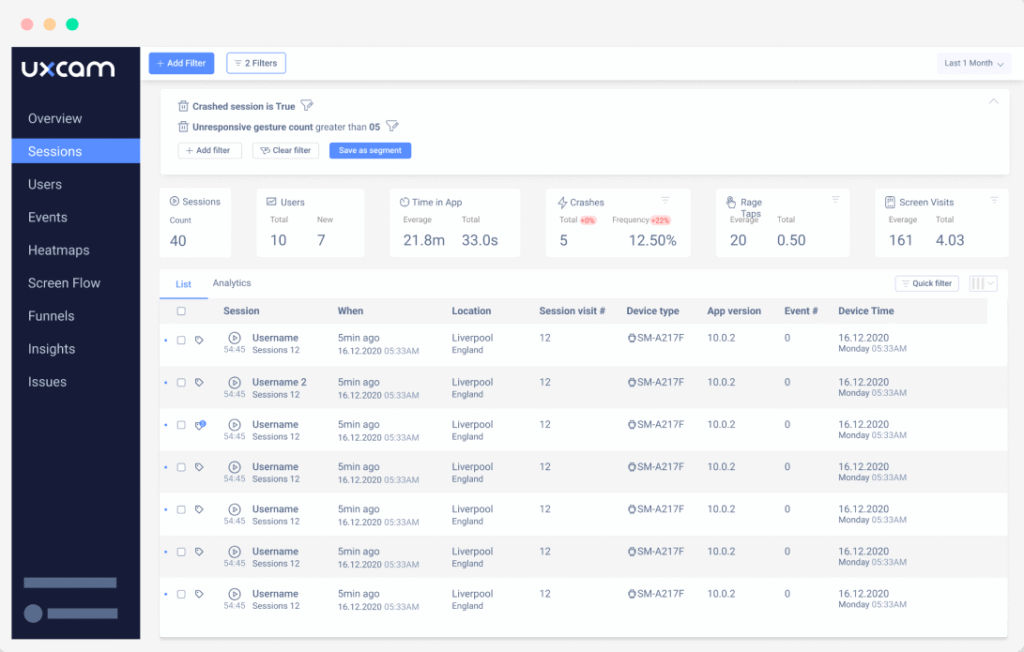
UXCam is an application interaction analytics service that enables companies to obtain fast, contextual, and accurate analytical data. UXCam offers an advanced view of the effectiveness of interface elements.
Benefits: Heatmaps allow you to analyze entry and exit points across devices and versions of the app, as well as identify problem areas by “rage maps” — repeated aggressive button presses. UXCam can also be used to record user interaction sessions with the app.
Tariffs: free, premium, and a separate tariff for large organizations.
The screenshot shows what the report looks like in real time:
Mobile app analytics is a very broad topic that requires a separate article. I will definitely write it one day 😉
The topic of analytics is actually quite complicated, especially if you have no experience. Could you tell us where to start to set up basic web analytics for beginners?
Violetta, the Head of PM:
The basic setup of analytics systems before launching advertising campaigns is the key to collecting quality data, as it is the foundation for doing business online.
Despite the block of universal settings, we approach each client individually. All analytical work is carried out in accordance with the client’s KPIs, goals, and objectives. The analyst, for his part, can recommend the introduction of new options and parameters that, in his opinion, will demonstrate the effectiveness of advertising campaigns on a deeper level. We rely heavily on our experience and provide recommendations on how to set up and track all the necessary parameters.
Andrii, Marketer, Traffic Manager:
I’ll briefly describe the basic systems that need to be set up before launching advertising campaigns.
Google Tag Manager (GTM) — allows you to place scripts on website pages without directly interfering with the website code.
GTM allows you to add and update scripts directly through the web interface, as well as set the rules for activating these scripts.
Google Tag Manager is a reliable and free tool.
It provides marketers with flexibility in their work, while webmasters can focus on the most important tasks without worrying about the little things. It is a solution for marketing professionals that provides a single interface for managing all tags on a website.
In addition to GTM, Google Analytics is also installed and configured. I have already described the capabilities of this system above. I just want to add that GA needs to be linked to all the advertising systems you plan to use.
Also, if your project has call tracking, it’s also better to set up automatic transfer from it to analytics.
You really need to be a specialist to understand all the systems. Is it possible to receive general reports in an understandable form?
Kateryna, the COO of Solve Marketing:
In general, it is possible to combine analytical data from all sources and generate visual reports that are understandable even to untrained people — this is Microsoft Power BI.
The main advantage of the system is its flexibility. You can customize data visualization exactly the way you need it. PBI is capable of transforming numbers into reports that are understandable to management and all managers to track changes in business indicators online on dynamic dashboards.
An analytical system built on the basis of Power BI can include:
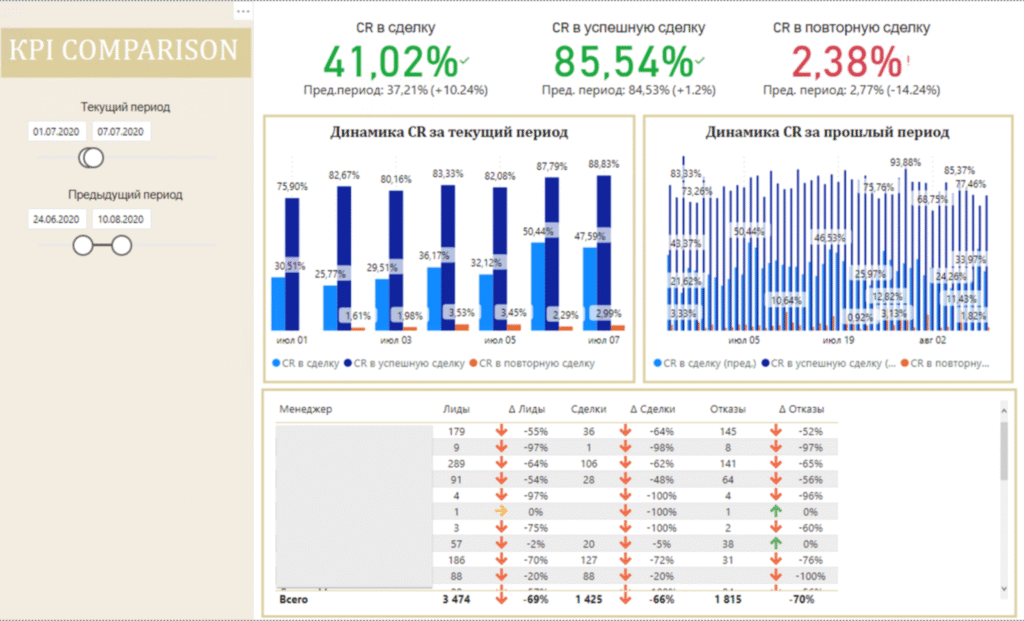
- analysis of managers’ activity. With the help of Power BI and a CRM system, we can link the activity of managers to the financial results they achieve;
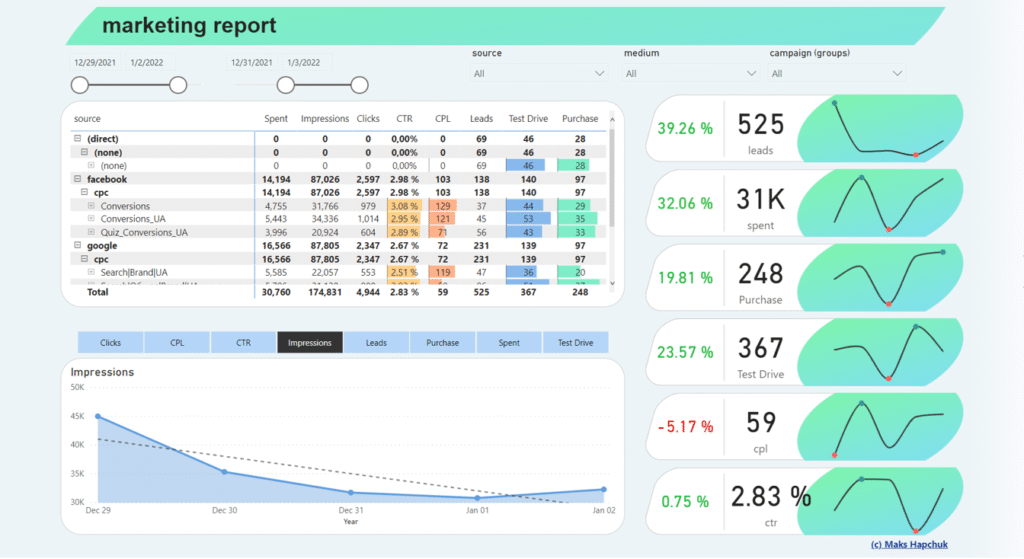
- end-to-end marketing analytics — simple, clear graphs and charts show the effectiveness of advertising not only by the number of clicks and leads, but also based on sales statistics;
- general report for the manager — a single dashboard, the pulse of the company, which combines data from all company reports. A strategic calculator will help you plan your next steps;
- financial analytics, as individual functions allow you to analyze finances according to managers, counterparties, and nomenclature online;
In general, Power BI is a powerful and multifunctional tool, so it’s difficult to describe all its functionality in one article.
I’ll just add a few examples of how reports built in this system look like, because it’s like a separate art form! For example, here is an end-to-end analytics:
And here is a report on the work of managers:
The topic of web analytics really needs a separate book, it is difficult to tell about everything in one article. So I think this is not the last interview on this topic.
Serhii, the Head of Marketing:
Our team designs and builds analytical systems so that you get all the information you need to make important business decisions on time.
If your business needs analytics automation, don’t hesitate to contact us for a consultation and we’ll help you choose the right solution for your needs.