In this case study, we will tell you how we built a marketing department for a SaaS IPTV project. But we’ll keep it a little secret because the customer asked us not to name the brand.
The project is an international service, SaaS.
The CMO of the project is Serhii Soloviov.
Service — marketing department: development of promotions, SMM promotion, creation of email newsletters, analytics, setup and launch of Facebook & Google ADS, development of advertising creatives and texts.
Navigating the case of SaaS promotion:
- Product
- Stage one. Identification of needs
- Stage two. Research
- Stage three. Lead generation
- Channels of user acquisition
- Analytics
- Marketing department in an international service
Estimated time for case study — 16 minutes
Product
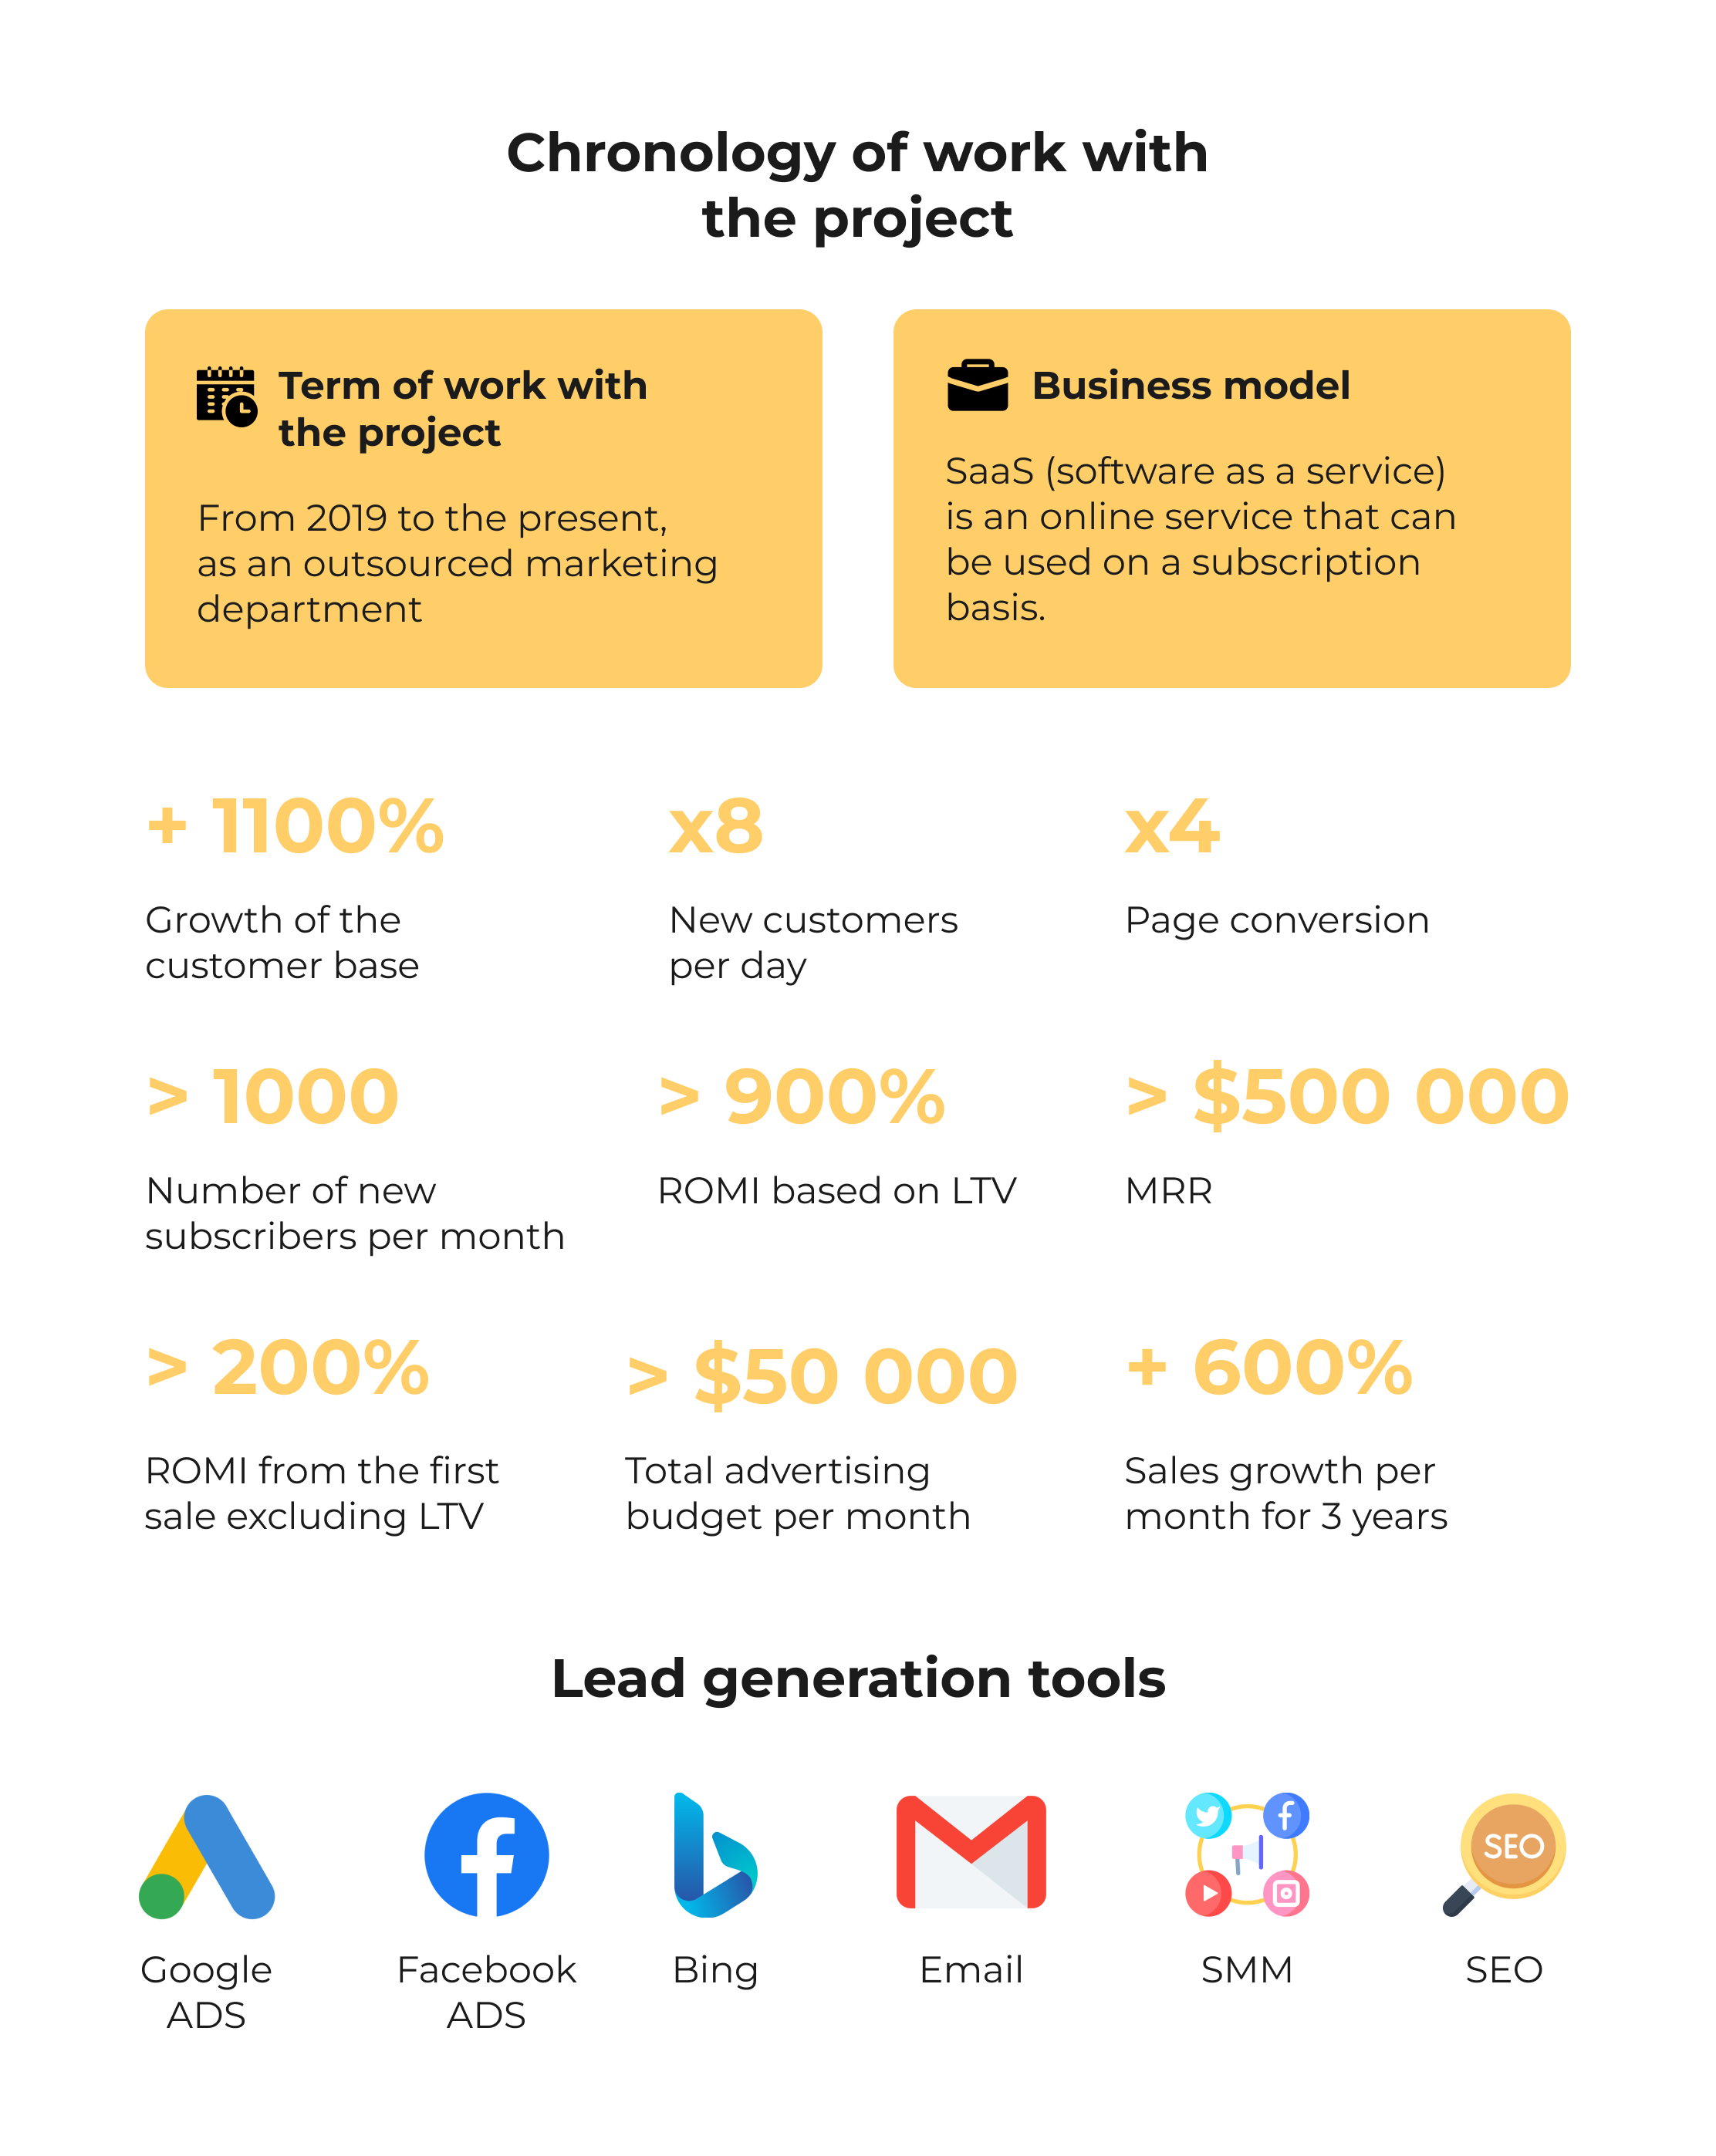
The business model of the project is SaaS, or software as a service, an online service that can be used on a subscription basis.
Stage one. Identifying the problems
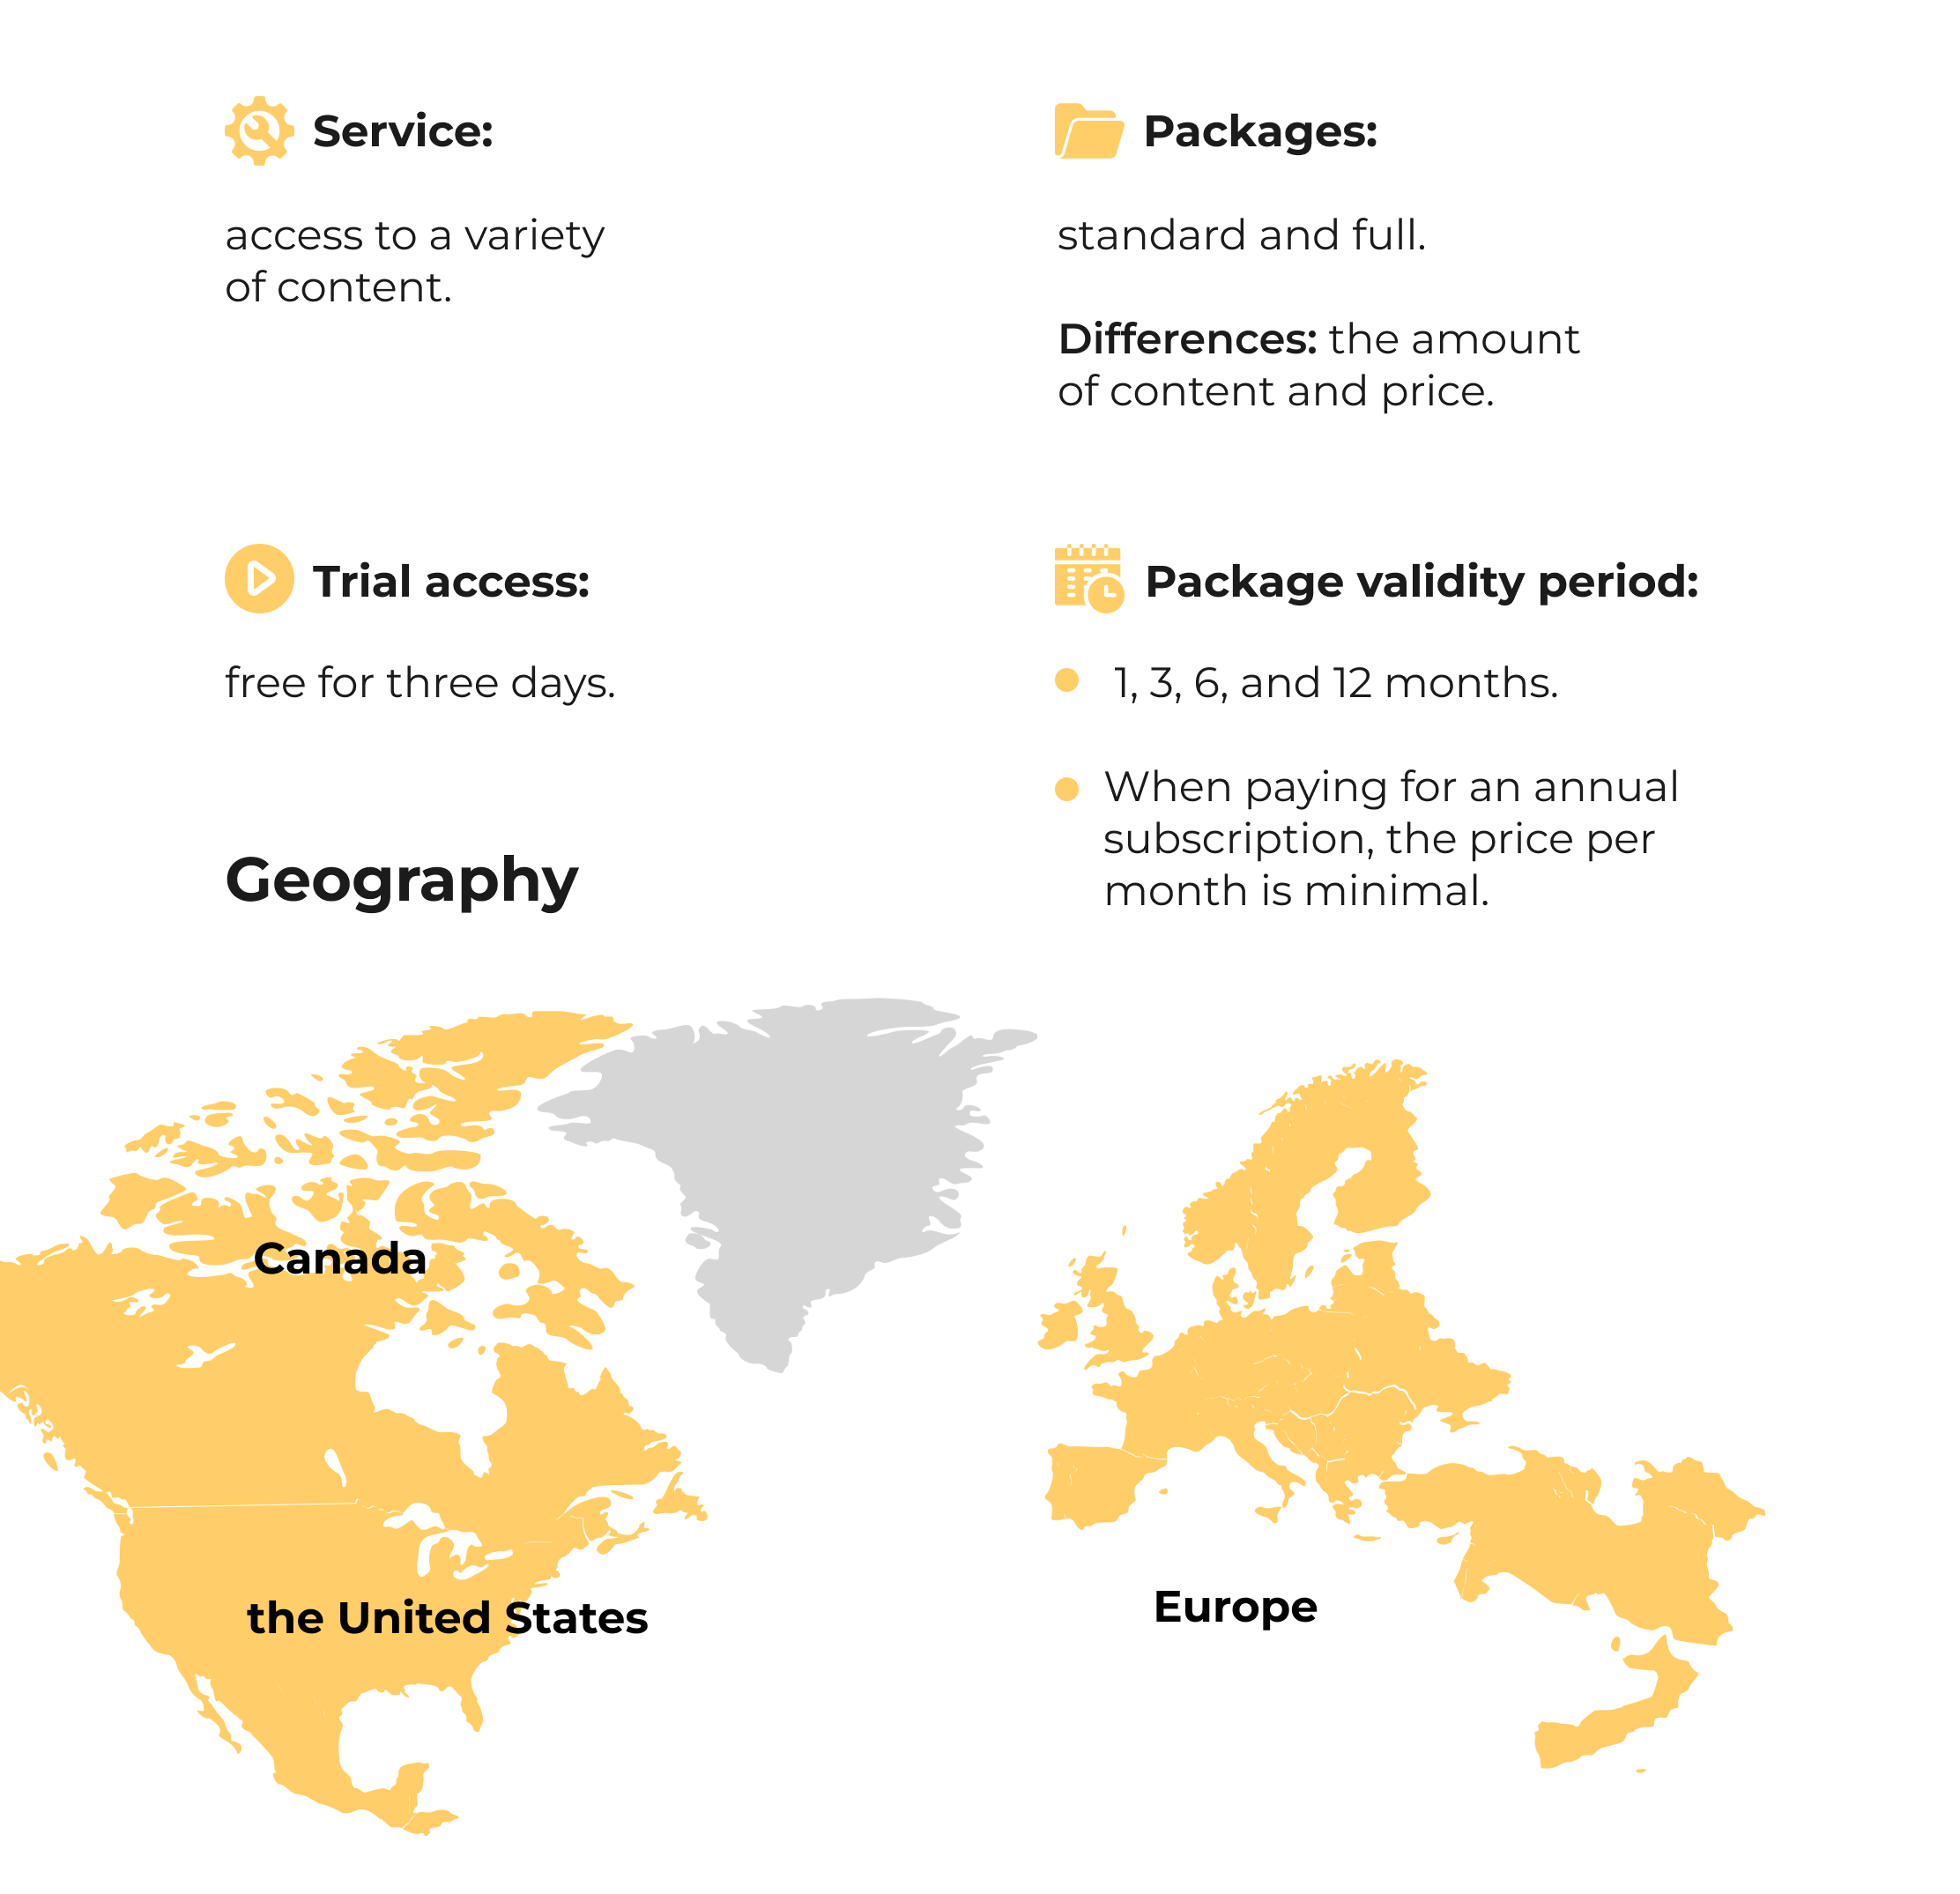
In the fall of 2018, we were approached by a client with an IPTV project operating in Europe and the United States and Canada. During the consultation, we identified and documented the following problems
Problem 1 — too slow growth in the number of new users.
The first strategic objective is to increase the growth of users at least three times from the current level.
Problem 2 — lack of coordination between contractors
Several contractors worked on the project, each responsible only for their own part of the work, without any idea of the global goals of the project.
The second strategic objective is to organize a team that will work toward a common goal.
First steps to solve problems:
- Comprehensively research the project. This will allow us to understand the direction we need to move in.
- Find ways to quickly increase the number of new subscribers to the service.
- Set up analytics. It is necessary to track the results of the promotion.
The second stage. Research
When we understand the main problems, we decompose them and divide each of them into parts.
The next step is a series of studies. They allow us to find answers to questions that are important for solving problems.
Stage three. Lead generation
Glossary of terms:
- ROMI — Return On Marketing Investment. The ratio of marketing income to the cost of attracting this income.
- LTV — Lifetime Value. The profit generated by a user over time.
- CAC — Cost of Customer Acquisition. The cost of customer acquisition.
- MRR — Monthly Recurring Revenue. The total monthly income generated by service subscribers.
Nowadays, thousands of new visitors come to the project’s website every day, converting into dozens of new users of the service.
Lead generation in numbers:
- The average ROMI excluding LTV is 370%. That is, for every dollar invested in the advertising budget, we earn an additional $3.7.
- ROMI with LTV is more than 370%.
- The average CAC in the US is $40.
- More than 1000 new paid subscribers per month.
- MRR of the project is more than $500,000.
Channels of user engagement
We started working on attracting users from three countries. Now we have subscribers from ten countries and have no plans to stop.
Over the three years of working with the service, the team has tested all the main channels of user acquisition and here are the statistics.
Channels and their share in the total lead generation of the project
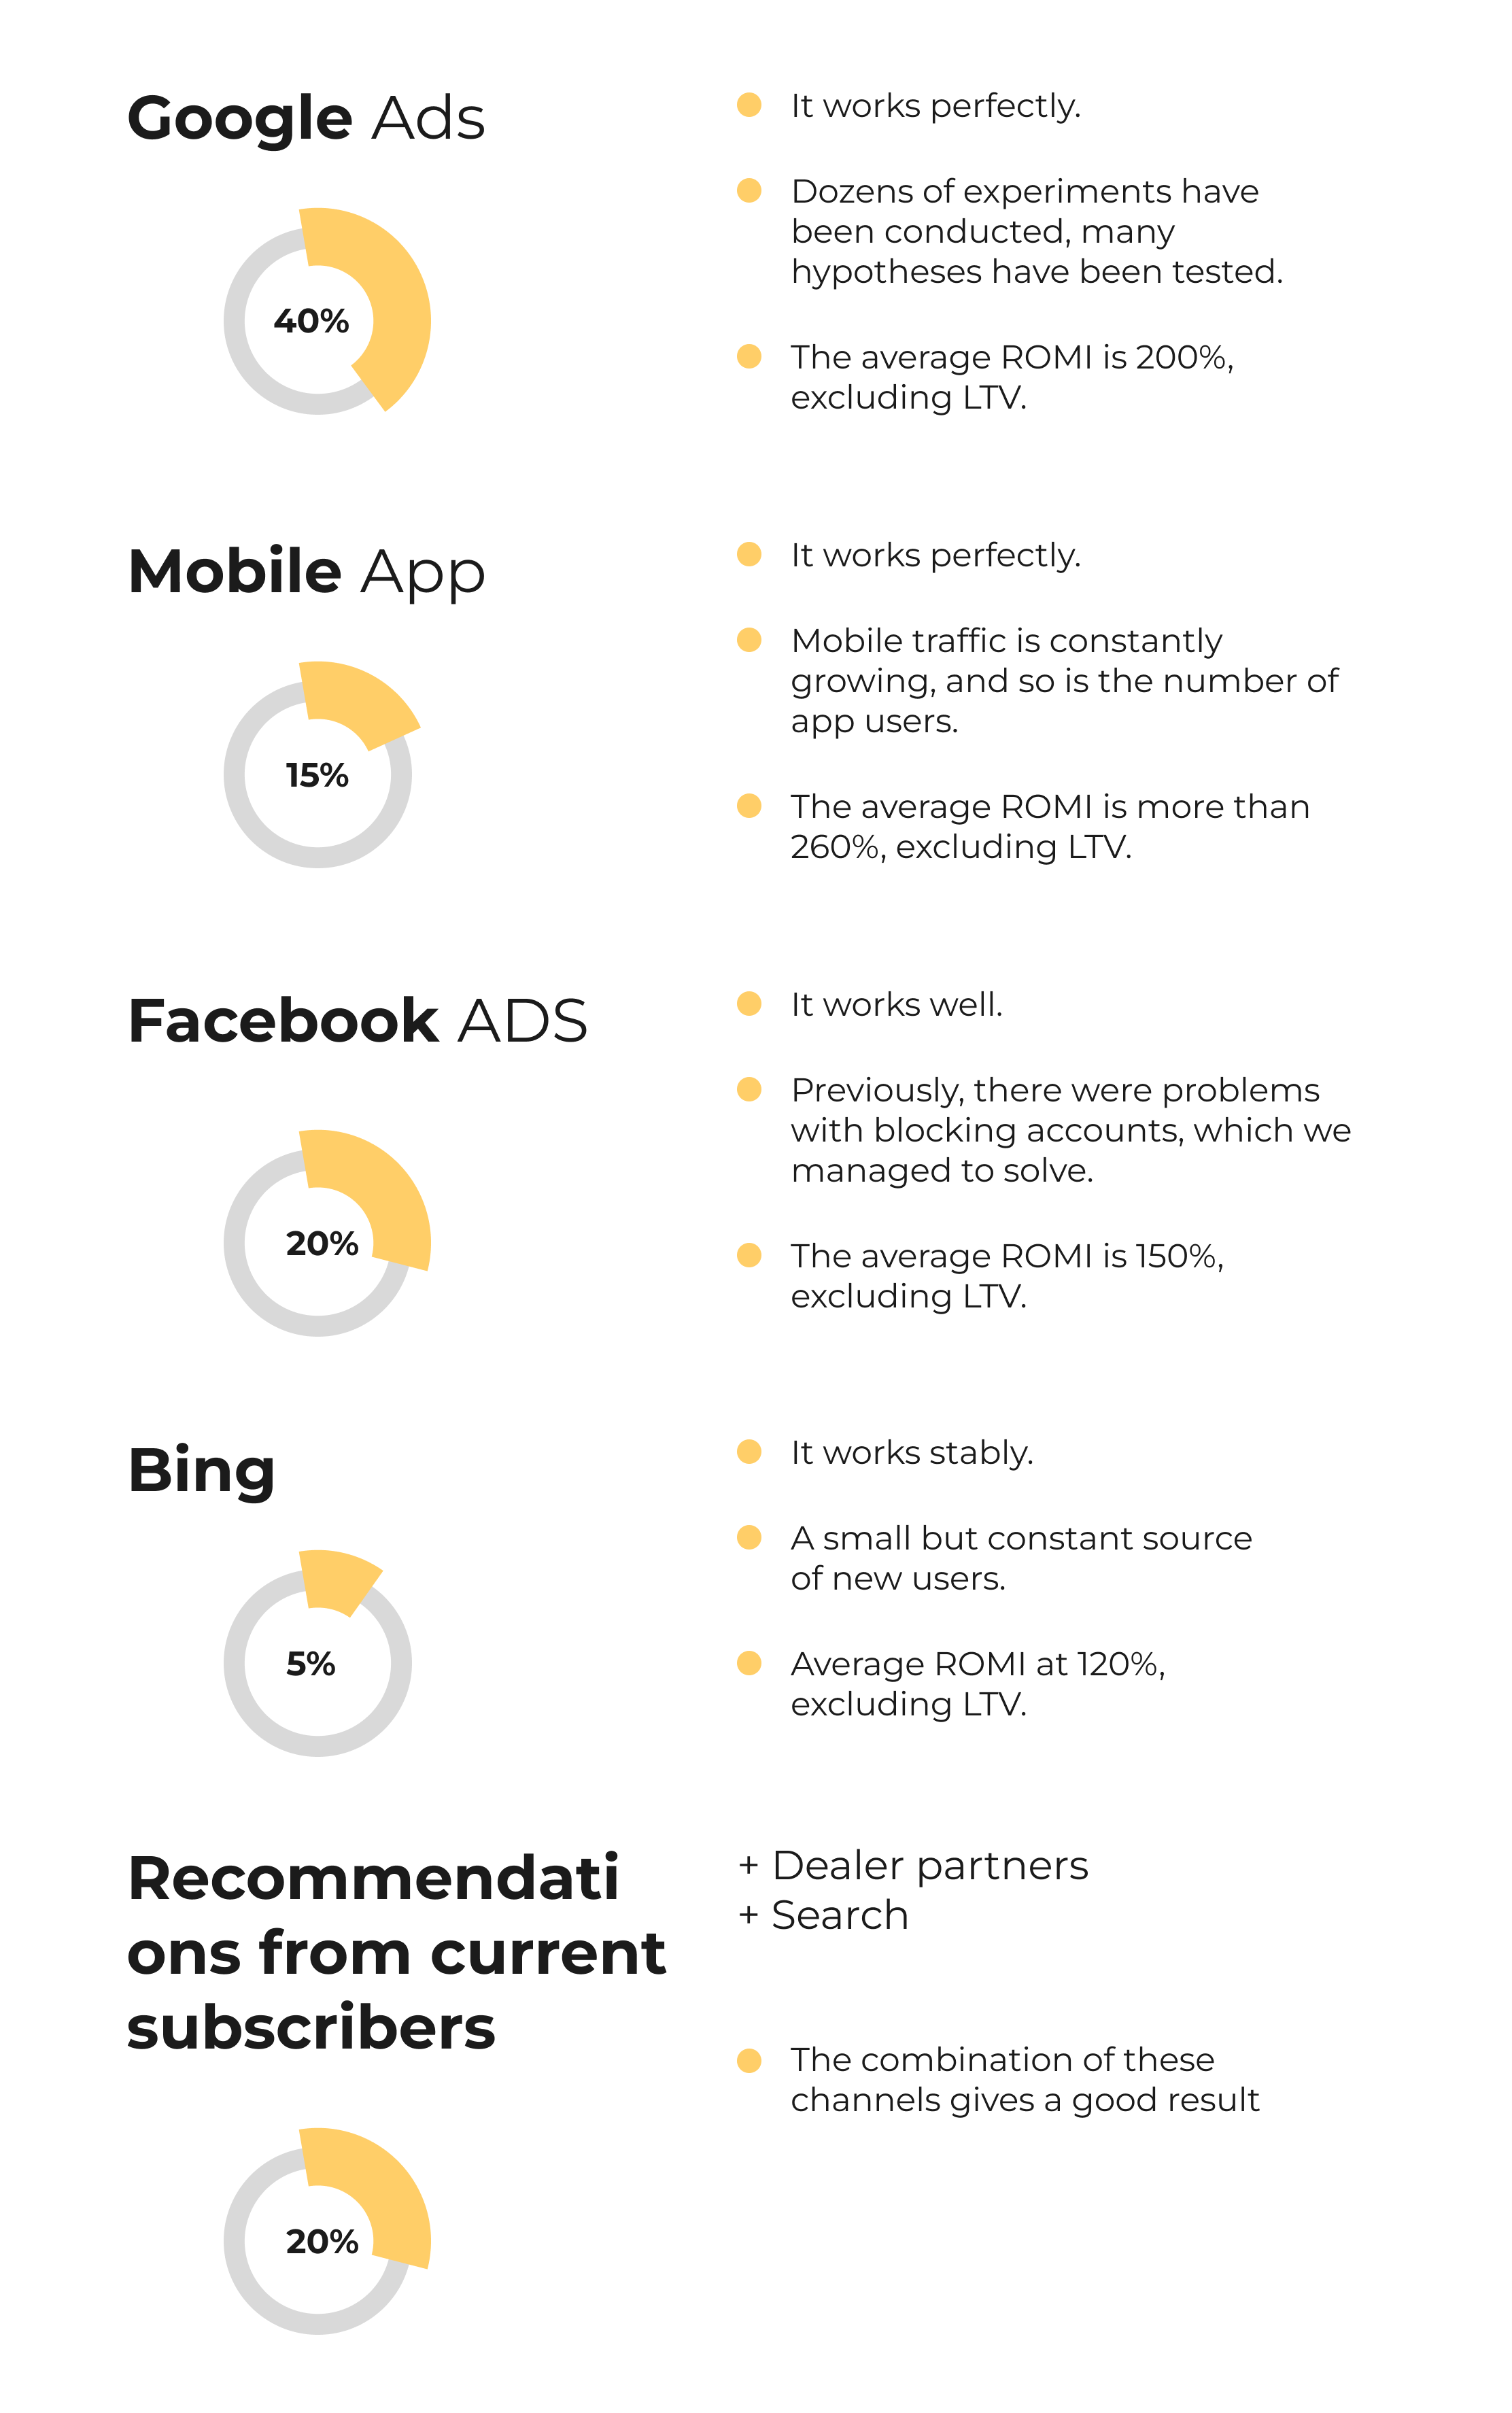
To identify the most effective channels of engagement, we tested and turned off many sources that did not yield a positive result.
For example:
- YouTube — users of this platform do not convert well into subscribers of our service.
- Instagram, TikTok — the demographic profile of users of these services does not match the project’s needs, so the conversion rate was also low.
User retention
Aren’t you tired of reading yet? They say that not every bird will make it to the middle of this case study 🙂 But this is where you will find very interesting and useful content: user retention tools and a description of the project team.
To keep in touch with the audience and sell more, we use three tools:
- promotions
- email newsletters;
- SMM.
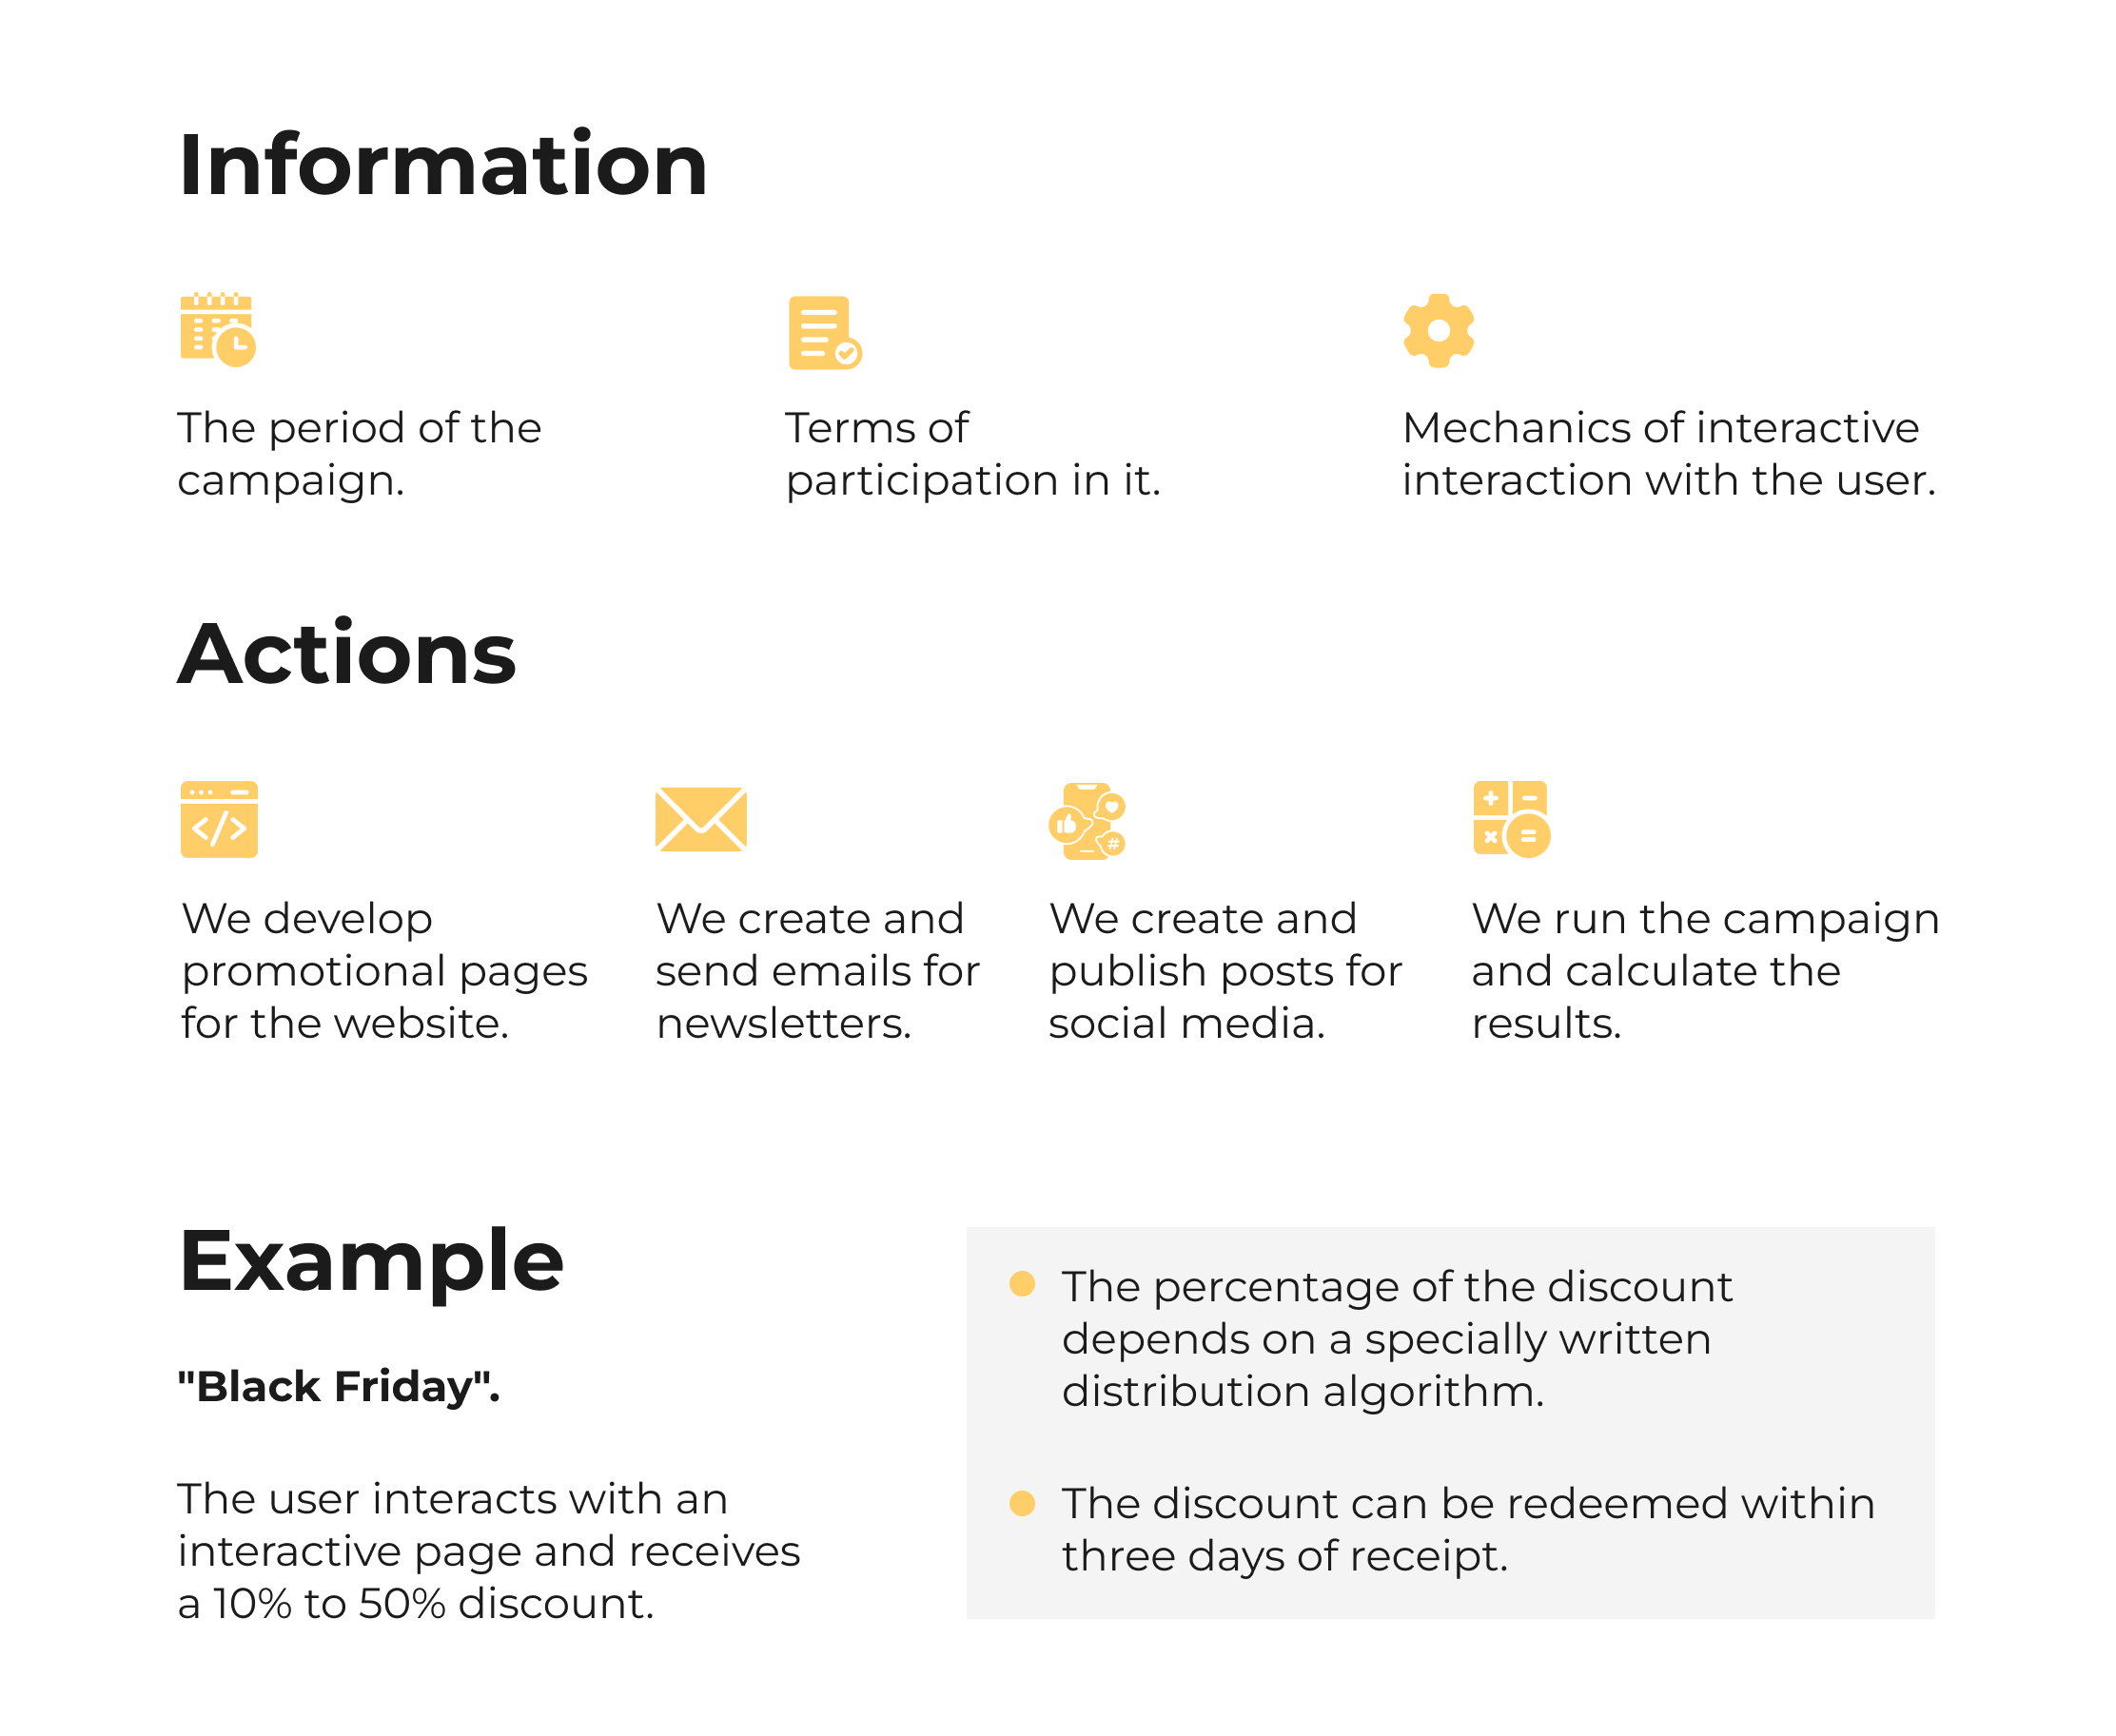
Promotions
Every six months, we design a promotional calendar. It contains the following information.
Email newsletters
Properly configured email marketing can bring in tens of thousands of dollars a month.
For the project, we create a content plan and send 10 to 15 emails every month. The basis of newsletters:
- service content announcements;
- notifications about promotions;
- congratulations on the holidays;
- news.
Here are the statistics of the channel for one of the months of work with it

To make emails work, you need to follow these rules:
- keep the goal of communication in focus;
- understand the audience;
- give emotion;
- keep it simple.
We’ve covered the principles of working with emails in more detail in this article.
Social networks
This channel is one of the main channels for broadcasting news. Here we also announce promotions and launch interactive activities. This way, we increase engagement with the brand and always keep the user in the information space of the service.
Our users also often write to our social media pages when they need technical support. We maintain this connection and attract as many of the service’s subscribers to the pages as possible. To do this, for example, we regularly raffle off subscriptions on social media.
Analytics
For a project that operates in many countries, it is important to understand how effective a particular engagement tool is for a particular region.
Thus, we know exactly the CAC and ROMI for each country where the service operates.
We also analyze the following advertising-related metrics:
- costs
- revenue;
- ROMI;
- number and cost of registrations;
- average check;
- cost of sales.
This is necessary for cost control and project development planning.
The customer, on the other hand, keeps the following in focus:
- the amount of advertising costs;
- the number of registrations and paid subscribers;
- the amount of monthly revenues from new and repeat sales separately.
All data is automatically collected in a system powered by BigQuery and Power BI. Thus, we see all the data in almost real-time, which allows us to quickly adjust our advertising strategy.
How do you quickly collect all the data for analysis?
Three years ago, at the beginning of the project, we collected data for analytics manually. It was easy because the number of sales was small and there were few advertising channels.
But as the project grew, it became very difficult to collect data manually. That’s when we started the automation process, its main goal being to eliminate the human factor from the process of searching, segmenting, and recording information. We are gradually getting closer to this.
Project analysts are no longer people who look for and record numbers in a spreadsheet. They read automatically generated reports, look for anomalies in them, and propose hypotheses to improve project results.
Project analytics, as we have already mentioned, is based on Google BigQuery and Power BI. We haven’t abandoned Google Spreadsheets either, but the data gets there automatically.
If you are just thinking about building an analytical system, you should start now. The agency’s practical experience suggests that analytics should be implemented as soon as possible when the data volumes are still small.
But you shouldn’t try to do everything at once. It’s better to move forward at a moderate pace, but steadily.
After two years of gradual automation of this project, we know everything about every channel and every country where new users come from. The collected data allows us to predict changes in trends throughout the year and weekly fluctuations in sales.
Thanks to analytics, we understand the reasons for what is happening right now and can predict what will happen tomorrow.
Marketing department in an international service
When we started working on the project, the marketing department consisted of five specialists. Now it has 12 employees, each of whom has a role in achieving a common result.
In our case, the marketing department for a SaaS project started with a lead generation team to quickly attract new users. Then, specialists working on retaining the customer base joined the team.
What we are working on now
Currently, the project is at the scaling stage, where every month we work on attracting the planned number of new subscribers within the established CAC. Our common goal with the customer is to increase MRR and continuously develop the product.
In addition, something happens in the life of every business all the time that requires a quick response. In our case, there are updates to the service, unexpected blocking of advertising accounts, and much more. We are ready for the unexpected and respond quickly to changes.
Unfortunately, we can’t disclose any interesting details, as we have agreed with the customer on non-disclosure of work details. Therefore, we can only write that the agency is really interested in working with the customer as a remote marketing department.
We are fully responsible for sales and work with project developers as a team.
Thank you for reading this huge case study to the end! 🙂 We will be glad if it was useful to you.