When a business owner invests in promotion, they want to understand which expenses are effective and which are not. Estimating this “by eye” is nearly impossible, especially when a product or service has a long decision-making cycle. This is where multi-channel funnels of Google Analytics come to the rescue. Below, we’ll explain what this tool is and how to use it.
Let’s start with the fact that Google Analytics, by default, uses the Last Interaction attribution model.
A few terms:
- Attribution is a rule in analytics that allows you to determine which channel had the greatest weight in driving a conversion. In other words, attribution helps you understand which part of the brand’s communication with the customer was most important on their path to completing a target action (purchase, registration, app installation, etc.).
- The Last Interaction attribution model is based on the assumption that the most valuable channel is the one a person interacted with right before making a purchase or completing another target action.
In the Last Interaction attribution model, the transaction is automatically credited to the channel that was last in the chain before the purchase. For example, if a person clicked on an ad, visited the website, and then clicked the “Buy” button, the report will indicate that the most important conversion channel was the website.
If your product or service falls into the impulse demand category — meaning it is purchased without long deliberation — this attribution model may work perfectly well for you. Examples of such products include souvenirs, inexpensive accessories, sweets, and similar items.
However, it’s important to note that if you run several advertising campaigns aimed at attracting customers, the reporting may turn out to be inaccurate. It’s entirely possible that before making the actual purchase, the client interacted with another one of your campaigns. As a result, you might mistakenly consider a channel effective that isn’t actually driving conversions, and end up allocating more budget to the wrong promotion direction.
In this case, it’s better to use another type of report available in Google Analytics — multi-channel funnels. This report shows you the full sequence of user interactions across different communication channels that led them to a conversion or microconversion. To leverage the data from this report, you first need to configure it correctly and then interpret the results properly.
Conversions in multi-channel funnels include:
- E-commerce transactions.
- Completion of predefined goals.
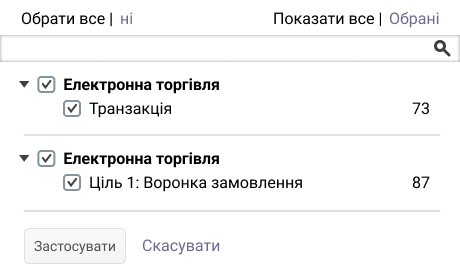
Goals are a Google Analytics feature that allows you to track user actions on a website or in an app that are valuable to your business.
While e-commerce transactions are straightforward, goals should be set thoughtfully — meaning they must provide useful insights for future ad budget optimization. For example, visiting a specific page is unlikely to be highly significant, whereas subscribing to a newsletter is an important step on the path to purchase.
Goals may include:
- Visiting a specific page, such as a payment page or an order confirmation (thank you) page.
- Staying on a page for longer than a specified time.
- Viewing a certain number of pages.
Multi-channel funnels allow you to understand:
- How much time passes between a customer’s initial interest in a product and their purchase.
- Which combination of advertising channels is the most effective.
- The role each channel plays in initiating or completing a conversion.
In multi-channel funnels, you can access the following types of reports:
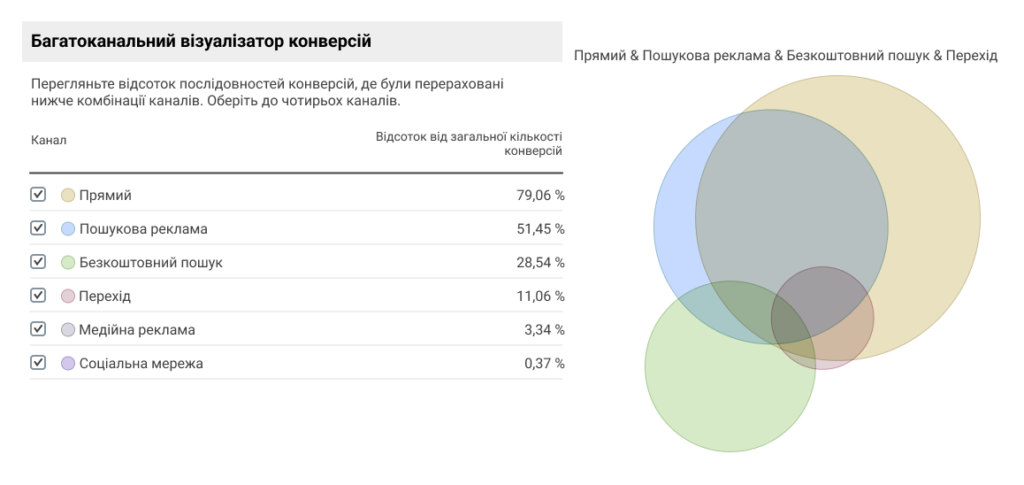
- Overview — in the Multi-Channel Conversion Visualizer, you can track how different traffic acquisition channels interact with each other.
- Top conversion paths — this report shows the paths your customers take on their way to conversion.
- Assisted conversions — this report helps you identify the role of a particular source in the customer’s conversion path. Its role may be initiating, assisting, or finalizing.
- Path length and time lag — this report shows how much time passed from the first interaction with a user to their purchase, as well as the total number of recorded interactions.
Sometimes analysts notice discrepancies between multi-channel funnel reports and other data sources. There are two main reasons for this:
- Data in multi-channel funnels is displayed with a two-day delay from the time events occurred.
- E-commerce transactions and goals defined in the interface are counted together in this report, whereas they are shown separately in other reports.
Conversion paths
This report provides a complete picture of how a customer interacted with your online marketing activities during the 30 days leading up to a conversion.
By reviewing this report, you can see that a person visited your website both directly and via search advertising. You can also view how many times each traffic source was used. In the example below, the data shows that the user most frequently accessed the site directly, meaning they typed the website address into the browser’s address line. Other possible sources may include organic search, paid advertising, email campaigns, and more.

This data is stored in a cookie called utmа. The report is generated for all completed goals. A conversion path can include up to 500 different sources.
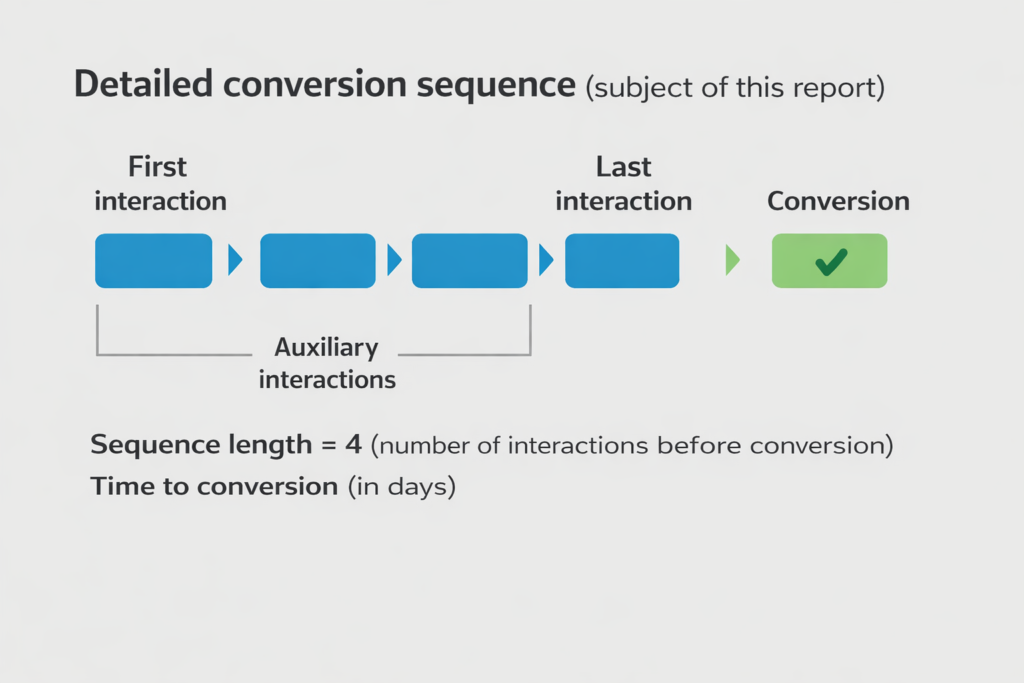
Detailed conversion path
As mentioned earlier, each source can play different roles in the customer’s journey:
- Final or last source — the source from which the user arrived immediately before converting.
- First or initial source — the source where the chain of actions leading to the conversion began.
- Assisting (associated) source — an intermediate source, meaning it was neither the first nor the last in the conversion chain.
To understand how important a specific channel is for the final conversion and how often it appears along the path, you need to review two reports in the Assisted Conversions tab:
- First interaction analysis.
- Assisted interaction analysis.
Channels in multi-channel funnels
All traffic sources can be grouped into two main channel categories.
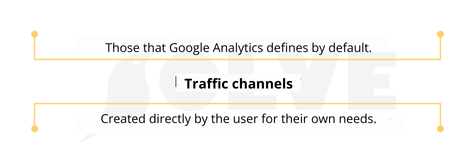
For analytics purposes, it’s useful that you don’t need to focus on basic channels alone. If needed, there’s a feature to create new channel groups, which can also be segmented. After that, you can evaluate the impact of each segment on conversions.
Below is how to set up channel groups. To optimize working with this data section, keep in mind the following:
- When creating a new group, you have the option to either copy the default set of channels or create your own. In the latter case, you need to add an additional “rule” with a name and properties on the editing page.
- In reports, a “rule” appears as a channel.
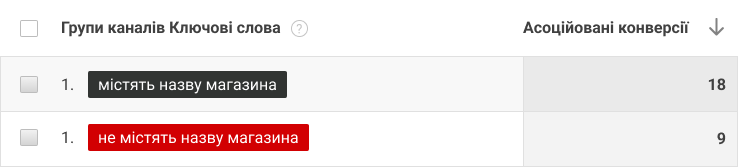
An example of creating a channel “Search queries with brand entry”
How to analyze conversion paths
When you need to understand the sequence of user interactions and draw conclusions, it’s important to change the primary parameter in the Top Conversion Paths report. There are nine such parameters in total.
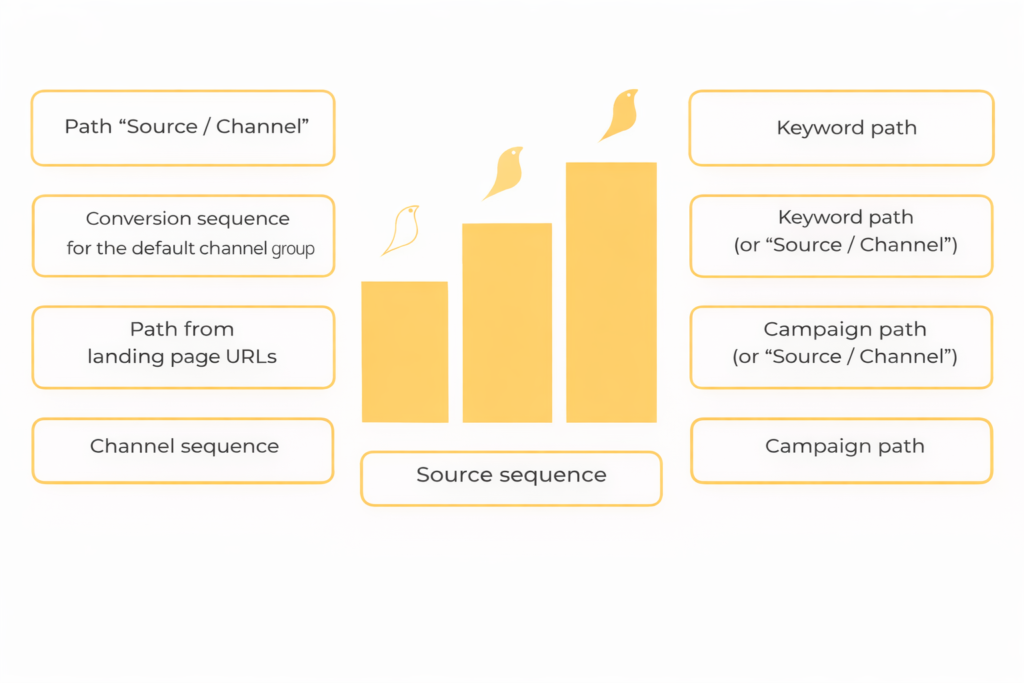
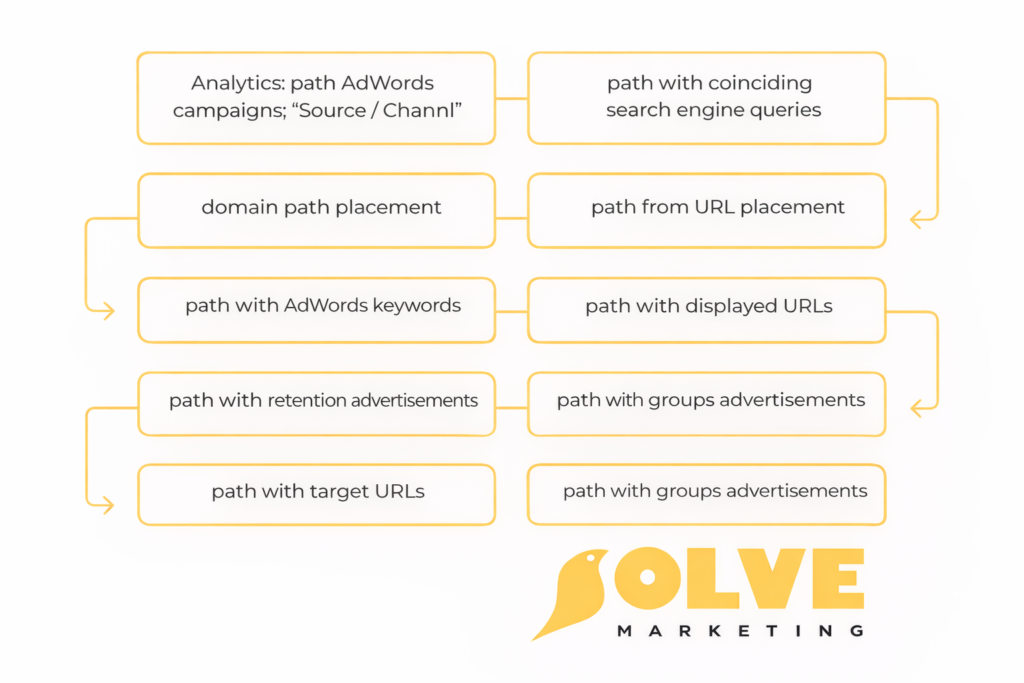
If you have linked your AdWords and Google accounts, the following parameters will be useful for you:
What different reports look like — examples:
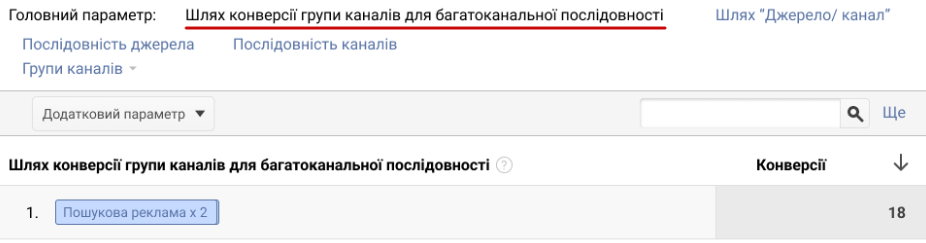
Conversion path by channel group in multi-channel funnels
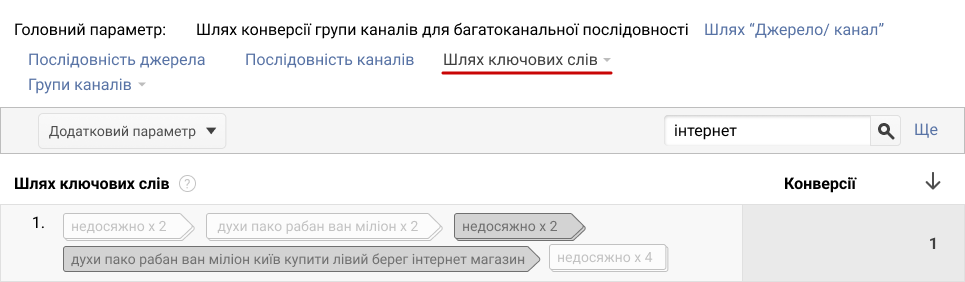
Keyword Path
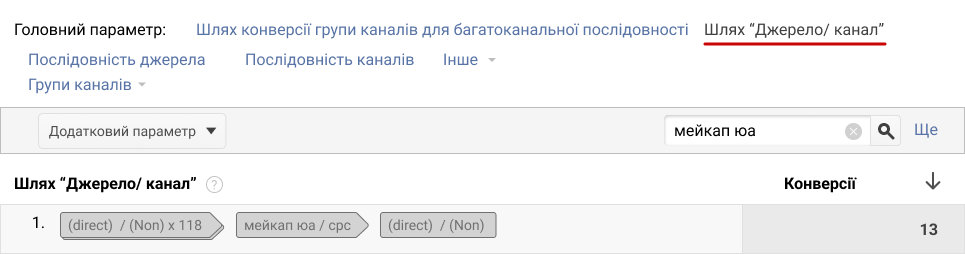
Source/Medium Path
Purpose of the metric “Assisted conversions/Last click or direct conversions”
If you see a value close to zero, the channel primarily plays a role near the end of the conversion path.
When the metric value is close to one, the channel appears equally often both at the beginning and at the end of the conversion chain.
A channel with a value greater than one usually plays a significant role at the start of the user’s path to conversion.
Regularly reviewing multi-channel funnel reports will help you understand which channels perform effectively at different stages of the conversion journey. This insight allows you to optimally allocate your advertising budget and achieve excellent promotion results.